Thanks, that's all I needed to know.silmarilen wrote:
ok then very well.
first of all, big black may be mapped at 360 bpm, but it plays like a 180 bpm map, so for all intents and purposes it is considered 180 bpm.
second of all, DT multiplies the bpm by 1.5x, not by 2x, so remote control DT would be 247.5.
ok now that that's out of the way lets move on to the next point
the score rrtyui got compared to someone else doesnt matter, all that matters is how difficult the map is according to the difficulty algorithm and rrtyui's combo/accuracy/amount of misses. so even if #2 had only 5 combo it still wouldnt make a difference to the amount of pp rrtyui would get. even if rrtyui was rank 4.000.000/4.000.000 it still wouldnt influence his pp at all
and then lets get on to the difficulty of the maps. as i already said, big black is not the hardest thing there is, i would look at it as an easier version of this map if it wasnt for the sliders
remote control has some fullscreen jumps (which are bigger than the ones on big black aswell) and adding DT makes it 247.5 bpm (thats a whole 67.5 more than big black, since we already agreed on that it's just 180 bpm). it also has a lot of triples and 1/2 notes at the start with difficult movement without much time for breathing. so yes, remote control is harder than big black
forum
Performance Points feedback and suggestions (Standard)
posted
Total Posts
2,750
Hello, are sliderbreaks counted when calculating pp? Because i got a -1 run (with 2? sliderbreaks) on this map http://osu.ppy.sh/b/285549 with 98.5%, and I expected that play to be worth more than nothing..
Is the length bonus factor, when calculating the accuracy pp of a play, independent from the accuracy percentage?
For SS, the expected probability of hitting each hit correctly tends to 100% (perfection) when increasing the amount of circles
[expected in the sense that the (probability of hitting each circle correctly) makes it so the (probability of getting a rate of correctly hit circles equal or higher than the rate of correctly hit circles in the score calculated) is equal to a predetermined probability],
while for 95% rate of 300s, the probability tends to be only 95% (and the value comes closer to 95% more quickly than in the SS case).
Because of that, accuracy-wise, there isn't much difference between getting 96%acc in 200 circles and 300 circles, while the difference is more notable between a SS in 200 circles and 300 circles.
As a way to quantify the difference, here is a set of graphs comparing how much the Expected Unstable Rate changes when changing the amount of circles (with a formula based on the expected unstable rate formula I showed months ago, but this time accounting for the probability of getting 50's and MISSES; this new formula shows similar values with high accuracy, but more accurate values with low accuracy,the downside is that it takes a ridiculous amount of time to calculate: calculating only 140 points for the graphs took about 1 hour Made a new algorithm to calculate it's value much faster). Here is a sample of the 2 formulas in a graph varying accuracy with the other variables constant: http://i.imgur.com/6LdrKIg.png (The one with the lower values on low accuracy is the new formula).
All the graphs are calculated with OD10 (changing the OD doesn't make much difference in the graphs with high accuracy, since with high accuracy the prevalent hit window is the one for 300s, so changing from OD7 to OD10 just roughly halves the expected unstable rate).
In the X axis is the amount of circles, and in the Y axis is (Expected UR with 100 circles) / (Expected UR with X circles) (that way the influence of accuracy alone and OD is discarded from the graph). That way, a Y value of "2" means half the expected unstable rate compared to 100 circles.
The 2 sets have the following difference:
The first set sets the (probability of getting the accuracy inputted in the formula, or more) with the (expected UR calculated) to 50% (that way, the accuracy corresponds to the median accuracy with only 1 try).
The second set tries to model the amount of expected retries a map would get based on the amount of circles: A map with 100 circles would be retried 108 times, with 200 circles half that amount, etc... (this assumes the player has the patience to play each map only a set amount of time, and that the amount of circles is directly proportional to the time each retry takes) This way maps that are more likely to get "fluke" accuracies caused by a lot of retries would give less (for example, a player who only has the skill needed to get 90% chance of hitting a 300 would eventually get a SS in a map with 30 circles if he retries a lot of times, but that would be practically impossible if the map has over 100 circles). If a map is replayed 50 times all with the same Unstable Rate, then the (probability of getting the accuracy inputted in the formula, or more) with the (expected UR calculated) is equal to 1/(1+50) (this corresponds to the formula of the expected value of the lowest value obtained in a perfect die with infinite sides with values that range from 0 to 1). I know this is not the best way to model the amount of retries, but it is something.
First Set:
http://i.imgur.com/SaWoo9P.png
http://i.imgur.com/jPIsZa6.png
Second Set:
http://i.imgur.com/hgVcl5O.png
http://i.imgur.com/OrmhWu2.png
Blue: Graph for SS.
Purple: Graph for 99%acc
Brown: Graph for 95%acc
Green: Graph for 85%acc (95% and 85% graph lines overlap each other since they have very similar values)
As you can see, in the SS case, the amount of circles has a bigger impact compared to the other cases with lower accuracy. Also, the point where increasing the amount of circles doesn't change significantly the expected unstable rate anymore is set farther to the right of the X axis when the accuracy increases. For any accuracy inferior to 100%, there is an horizontal asymptote of the graphs, but for 100%accuracy, the Y value goes to infinity (since, with an infinite amount of circles, the expected UR to get 100%accuracy is 0).
For high accuracy on circles (Acc > 0.7, so the hit window of the 300 judgment is predominant), the value of the asymptote for the expected unstable rate is approximately: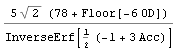 (The asymptote is the same both for the cases with only 1 retry and several expected retries).
For SS, the expected probability of hitting each hit correctly tends to 100% (perfection) when increasing the amount of circles
[expected in the sense that the (probability of hitting each circle correctly) makes it so the (probability of getting a rate of correctly hit circles equal or higher than the rate of correctly hit circles in the score calculated) is equal to a predetermined probability],
while for 95% rate of 300s, the probability tends to be only 95% (and the value comes closer to 95% more quickly than in the SS case).
Because of that, accuracy-wise, there isn't much difference between getting 96%acc in 200 circles and 300 circles, while the difference is more notable between a SS in 200 circles and 300 circles.
As a way to quantify the difference, here is a set of graphs comparing how much the Expected Unstable Rate changes when changing the amount of circles (with a formula based on the expected unstable rate formula I showed months ago, but this time accounting for the probability of getting 50's and MISSES; this new formula shows similar values with high accuracy, but more accurate values with low accuracy,
All the graphs are calculated with OD10 (changing the OD doesn't make much difference in the graphs with high accuracy, since with high accuracy the prevalent hit window is the one for 300s, so changing from OD7 to OD10 just roughly halves the expected unstable rate).
In the X axis is the amount of circles, and in the Y axis is (Expected UR with 100 circles) / (Expected UR with X circles) (that way the influence of accuracy alone and OD is discarded from the graph). That way, a Y value of "2" means half the expected unstable rate compared to 100 circles.
The 2 sets have the following difference:
The first set sets the (probability of getting the accuracy inputted in the formula, or more) with the (expected UR calculated) to 50% (that way, the accuracy corresponds to the median accuracy with only 1 try).
The second set tries to model the amount of expected retries a map would get based on the amount of circles: A map with 100 circles would be retried 108 times, with 200 circles half that amount, etc... (this assumes the player has the patience to play each map only a set amount of time, and that the amount of circles is directly proportional to the time each retry takes) This way maps that are more likely to get "fluke" accuracies caused by a lot of retries would give less (for example, a player who only has the skill needed to get 90% chance of hitting a 300 would eventually get a SS in a map with 30 circles if he retries a lot of times, but that would be practically impossible if the map has over 100 circles). If a map is replayed 50 times all with the same Unstable Rate, then the (probability of getting the accuracy inputted in the formula, or more) with the (expected UR calculated) is equal to 1/(1+50) (this corresponds to the formula of the expected value of the lowest value obtained in a perfect die with infinite sides with values that range from 0 to 1). I know this is not the best way to model the amount of retries, but it is something.
First Set:
http://i.imgur.com/SaWoo9P.png
http://i.imgur.com/jPIsZa6.png
Second Set:
http://i.imgur.com/hgVcl5O.png
http://i.imgur.com/OrmhWu2.png
Blue: Graph for SS.
Purple: Graph for 99%acc
Brown: Graph for 95%acc
Green: Graph for 85%acc (95% and 85% graph lines overlap each other since they have very similar values)
As you can see, in the SS case, the amount of circles has a bigger impact compared to the other cases with lower accuracy. Also, the point where increasing the amount of circles doesn't change significantly the expected unstable rate anymore is set farther to the right of the X axis when the accuracy increases. For any accuracy inferior to 100%, there is an horizontal asymptote of the graphs, but for 100%accuracy, the Y value goes to infinity (since, with an infinite amount of circles, the expected UR to get 100%accuracy is 0).
For high accuracy on circles (Acc > 0.7, so the hit window of the 300 judgment is predominant), the value of the asymptote for the expected unstable rate is approximately:
[SilknoHearto]
dat information tho.Full Tablet wrote:
Is the length bonus factor, when calculating the accuracy pp of a play, independent from the accuracy percentage?
For SS, the expected probability of hitting each hit correctly tends to 100% (perfection) when increasing the amount of circles
[expected in the sense that the (probability of hitting each circle correctly) makes it so the (probability of getting a rate of correctly hit circles equal or higher than the rate of correctly hit circles in the score calculated) is equal to a predetermined probability],
while for 95% rate of 300s, the probability tends to be only 95% (and the value comes closer to 95% more quickly than in the SS case).
Because of that, accuracy-wise, there isn't much difference between getting 96%acc in 200 circles and 300 circles, while the difference is more notable between a SS in 200 circles and 300 circles.
As a way to quantify the difference, here is a set of graphs comparing how much the Expected Unstable Rate changes when changing the amount of circles (with a formula based on the expected unstable rate formula I showed months ago, but this time accounting for the probability of getting 50's and MISSES; this new formula shows similar values with high accuracy, but more accurate values with low accuracy, the downside is that it takes a ridiculous amount of time to calculate: calculating only 140 points for the graphs took about 1 hour). Here is a sample of the 2 formulas in a graph varying accuracy with the other variables constant: http://i.imgur.com/6LdrKIg.png (The one with the lower values on low accuracy is the new formula).
All the graphs are calculated with OD10 (changing the OD doesn't make much difference in the graphs with high accuracy, since with high accuracy the prevalent hit window is the one for 300s, so changing from OD7 to OD10 just roughly halves the expected unstable rate).
In the X axis is the amount of circles, and in the Y axis is (Expected UR with 100 circles) / (Expected UR with X circles) (that way the influence of accuracy alone and OD is discarded from the graph). That way, a Y value of "2" means half the expected unstable rate compared to 100 circles.
The 2 sets have the following difference:
The first set sets the (probability of getting the accuracy inputted in the formula, or more) with the (expected UR calculated) to 50% (that way, the accuracy corresponds to the median accuracy with only 1 try).
The second set tries to model the amount of expected retries a map would get based on the amount of circles: A map with 100 circles would be retried 108 times, with 200 circles half that amount, etc... (this assumes the player has the patience to play each map only a set amount of time, and that the amount of circles is directly proportional to the time each retry takes) This way maps that are more likely to get "fluke" accuracies caused by a lot of retries would give less (for example, a player who only has the skill needed to get 90% chance of hitting a 300 would eventually get a SS in a map with 30 circles if he retries a lot of times, but that would be practically impossible if the map has over 100 circles). If a map is replayed 50 times all with the same Unstable Rate, then the (probability of getting the accuracy inputted in the formula, or more) with the (expected UR calculated) is equal to 1/(1+50) (this corresponds to the formula of the expected value of the lowest value obtained in a perfect die with infinite sides with values that range from 0 to 1). I know this is not the best way to model the amount of retries, but it is something.
First Set:
http://i.imgur.com/SaWoo9P.png
http://i.imgur.com/jPIsZa6.png
Second Set:
http://i.imgur.com/hgVcl5O.png
http://i.imgur.com/OrmhWu2.png
Blue: Graph for SS.
Purple: Graph for 99%acc
Brown: Graph for 95%acc
Green: Graph for 85%acc (95% and 85% graph lines overlap each other since they have very similar values)
As you can see, in the SS case, the amount of circles has a bigger impact compared to the other cases with lower accuracy. Also, the point where increasing the amount of circles doesn't change significantly the expected unstable rate anymore is set farther to the right of the X axis when the accuracy increases. For any accuracy inferior to 100%, there is an horizontal asymptote of the graphs, but for 100%accuracy, the Y value goes to infinity (since, with an infinite amount of circles, the expected UR to get 100%accuracy is 0).
For high accuracy on circles (Acc > 0.7, so the hit window of the 300 judgment is predominant), the value of the asymptote for the expected unstable rate is approximately:
http://osu.ppy.sh/b/161787?m=0
I just want to ask to see whether or not this map gives a bit too much pp; CS4 AR9 OD7 with circle streams and triples, but is relatively short.
IMO it's giving a bit more than what is deserved, given that the circular streams only require a couple tries to get correct if you are already capable of doing 180BPM streams.
EDIT: I just want to add that I got 157pp with one missing combo (slider 100) and 96.34% acc. I would have thought that the extensively longer jump maps that have the same CS, OD, AR which I landed 99%+ acc on would be scored higher.
I always felt like this map gave a little bit too much pp, I guess it's because of the long-ish spaced streams?
That's probably the reason, but I feel that it's still too short and too easy to get used to for the amount that it gives.
map length should not be an indicator for how much pp a map gives, perfect example being this map https://osu.ppy.sh/s/20328
i personally think the map is you linked pretty hard to fc and worth the pp it gives.
i personally think the map is you linked pretty hard to fc and worth the pp it gives.
Soarezi
THIS gives a bit too much PPGoldenWolf wrote:
I always felt like this map gave a little bit too much pp, I guess it's because of the long-ish spaced streams?

I guess you're right, that was probably a poor thing to add on my part.silmarilen wrote:
map length should not be an indicator for how much pp a map gives, perfect example being this map https://osu.ppy.sh/s/20328
i personally think the map is you linked pretty hard to fc and worth the pp it gives.
Yeah, I've noticed spaced stream maps are worth a ton of pp. Two more maps I've noticed along with that one are:GoldenWolf wrote:
I always felt like this map gave a little bit too much pp, I guess it's because of the long-ish spaced streams?
https://osu.ppy.sh/s/46218
https://osu.ppy.sh/s/28751
Look at the star ratings, they are definitely worth more than they should.
Gimme nightcore seems a little bit overrated yeah, but there are no spaced stream in rog-unlimitation though, the star rating there is fine because it has two 64 circles streams at 220bpm...
am I the only one who finds both of those maps incredibly hard compared to other maps worth more points simply because of jumps which are super easy?
Probably because you're 2gud at jumpsAqo wrote:
am I the only one who finds both of those maps incredibly hard compared to other maps worth more points simply because of jumps which are super easy?
I have seen rog-unlimitation in a lot of Top Performances, so it probably is overrated. Except for the 220bpm mashing there's no skill involved in fc'ing it anyway.
I know it's hard, but it has a star rating on par with like kokou no sousei and other maps that I think are more difficult without a doubt.GoldenWolf wrote:
Gimme nightcore seems a little bit overrated yeah, but there are no spaced stream in rog-unlimitation though, the star rating there is fine because it has two 64 circles streams at 220bpm...
They're not the same, kokou no sousei has fullscreen squares at 240bpm, rog-unlimitation deathstreams at 220.. not the same kind of difficulty at allRewben2 wrote:
I know it's hard, but it has a star rating on par with like kokou no sousei and other maps that I think are more difficult without a doubt.
I see what you mean, they are difficult in their own ways, do you really think unlimitation is nearly as hard as sousei? Sousei has no fc's (apart from you know who) and unlimitation has multiple HDHR scores, lol. I think there are very little players that would actually find unlimitation harder despite having a higher star rating.GoldenWolf wrote:
They're not the same, kokou no sousei has fullscreen squares at 240bpm, rog-unlimitation deathstreams at 220.. not the same kind of difficulty at allRewben2 wrote:
I know it's hard, but it has a star rating on par with like kokou no sousei and other maps that I think are more difficult without a doubt.
who?
I guess it's because it's easy to mash rog-unlimitation, and since people care more about speed than 240BPM AR9 fullscreen squares, teehee
I guess it's because it's easy to mash rog-unlimitation, and since people care more about speed than 240BPM AR9 fullscreen squares, teehee
On the topic of map length: https://osu.ppy.sh/b/339058 <- This map with DT is 22 seconds long, and gives 134 pp at 100% accuracy, which is way too farmable. Sure it has some decent-ish jumps, but you get used to them in a few retries. Is the pp gained from a map affected by the amount of hit objects logarithmically?
134pp is nothing, the map is star rating 2.23, i know maps with similar star rating that give close to 200pp *cough* https://osu.ppy.sh/b/112645 *cough*
Damn ponies and their pp. It seems as though shorter maps have way too much emphasis on accuracy, considering how easy it is to retry them until you get a better percentage.silmarilen wrote:
134pp is nothing, the map is star rating 2.23, i know maps with similar star rating that give close to 200pp *cough* https://osu.ppy.sh/b/112645 *cough*
I suggest you to read the pp wiki about accuracymcdoomfrag wrote:
Damn ponies and their pp. It seems as though shorter maps have way too much emphasis on accuracy, considering how easy it is to retry them until you get a better percentage.
Mind elaborating? I feel as though I'm missing something.GoldenWolf wrote:
I suggest you to read the pp wiki about accuracymcdoomfrag wrote:
Damn ponies and their pp. It seems as though shorter maps have way too much emphasis on accuracy, considering how easy it is to retry them until you get a better percentage.
accuracy points is calculated on the number of circles of a map and how high the OD is, it has nothing to do with the actual length of the map
http://osu.ppy.sh/b/227061
This map and similar ones are extremely underrated by the current system because what's the main challenge of the map is reading. I mean, the top 50 isn't even all FC (granted that's because of the 1/6 at the end but still).
Is there any chance of this getting improved at some point?
This map and similar ones are extremely underrated by the current system because what's the main challenge of the map is reading. I mean, the top 50 isn't even all FC (granted that's because of the 1/6 at the end but still).
Is there any chance of this getting improved at some point?
almost half of the pp from the map i linked comes from accuracy, purely because it's od8+dt, there are other sub 300combo maps that give similar acc score, boosting them up by tons when they arent actually hard mapsGoldenWolf wrote:
accuracy points is calculated on the number of circles of a map and how high the OD is, it has nothing to do with the actual length of the map
Other examples of this are https://osu.ppy.sh/b/27737&m=0 and https://osu.ppy.sh/s/155691m, a lot of the difficulty is reading which the current system doesn't recognize at the moment. Tom said that he's still working on creating a satisfying algorithm for maps like these.Zare wrote:
http://osu.ppy.sh/b/227061
This map and similar ones are extremely underrated by the current system because what's the main challenge of the map is reading. I mean, the top 50 isn't even all FC (granted that's because of the 1/6 at the end but still).
Is there any chance of this getting improved at some point?
peppy's defense for making FL not give as much pp (at start of ppv2, granted, dunno how it's going to work now Tom behind the reigns) is because FL has to do more with memorization, which he thinks defeats the purpose of a rhythm game.
But current pp version IS v2TMoI wrote:
peppy's defense for making FL not give as much pp (during ppv2, granted, dunno how it's going to work now Tom behind the reigns) is because FL has to do more with memorization, which he thinks defeats the purpose of a rhythm game.
oopsGoldenWolf wrote:
But current pp version IS v2TMoI wrote:
peppy's defense for making FL not give as much pp (during ppv2, granted, dunno how it's going to work now Tom behind the reigns) is because FL has to do more with memorization, which he thinks defeats the purpose of a rhythm game.
I kinda meant prior to Tom's getting on board, that's just misinfo on my part ;-; will word properly
http://osu.ppy.sh/b/256819
this is fucking brutal to get good Acc on.
Frostmourne's 99% score on the map only gives him 117 pp. Acc difficulty isn't only determined by OD and amount of circles. When a song is this slow and still has so many friggin circles as opposed to sliders, it should get a huge bonus on acc pp imo.
this is fucking brutal to get good Acc on.
Frostmourne's 99% score on the map only gives him 117 pp. Acc difficulty isn't only determined by OD and amount of circles. When a song is this slow and still has so many friggin circles as opposed to sliders, it should get a huge bonus on acc pp imo.
Silynn's score on that song is the best
I know this may be kinda selfish to ask, but can someone put this on the wiki? I'm not 100% sure of where to put it. I was thinking about this and the only way to find it was to go back quite a bit of pages. This piece of info can be interesting to some players.Tom94 wrote:
I forgot to mention this on the wiki-page:
Every score gives a small base pp amount of 0.25, decreasing by a bit with every new highscore that you make. With 1000 highscores you get around 200pp and with 5000 around 400pp. The cap is 416.666pp at the moment, assuming infinitely many highscores are possible.
(pp gain = 0.25 * sum 0.9994^i, i=0 to amount of highscores)
This gets less and less relevant the higher your pp goes and is meant to both encourage playing more maps for the lower-level players and prevent big rank losses after making a new score at the lower ranks.
In the mid-high ranks it is pretty much irrelevant, since 99% of the people have enough highscores to be less than 50pp away from the cap.
And also, that small base pp can amount to way too many ranks. In my case, I need to click 18 times to show all my scores on my page and you have 50 scores showing when you first open it + 50 more from each click. That means I have 900-950 scores. If i just played easy/normal maps until I got closer to the cap I would jump from rank 2757 to 2050 or lower as of right now (something between 235 and 242 pp). I feel like this kind of jump is too huge, maybe you could put a hard cap on a lower amount of scores.
I'll just quickly do the math for you to show you just how inefficient that kind of "farming" would be:tfg50 wrote:
And also, that small base pp can amount to way too many ranks. In my case, I need to click 18 times to show all my scores on my page and you have 50 scores showing when you first open it + 50 more from each click. That means I have 900-950 scores. If i just played easy/normal maps until I got closer to the cap I would jump from rank 2757 to 2050 or lower as of right now (something between 235 and 242 pp). I feel like this kind of jump is too huge, maybe you could put a hard cap on a lower amount of scores.
Bonus pp at 950 scores (you): 0.25*(1-0.9994^950)/(1-0.9994) = 181 (rounded of course)
Bonus pp at 2000 scores (please imagine how long farming 1050 easy/normal scores would take): 0.25*(1-0.9994^2000)/(1-0.9994) = 291 (again, rounded)
So for ~1050 additional plays you would only get 110pp. Doesn't sound worth it to me. In fact, in the time it takes for you to farm that many scores, others will get actual good scores and surpass you again.
why do these 0108 songs give so little PP like only 160 more or less if only a few people can fc with 1 mod..? i think they should give like 250 or something lol
the accuracy is over 98% in case
the accuracy is over 98% in case
I believe It´s because:
1) They Were FC´d with 93% accuracy which lowers the amount of pp gain by alot, meaning that if it would have been a 99% acc score then the pp would probably be around 220 something.
2) probably most accurate guess... that wasn´t a full combo just an S with a decent accuracy. Probably got slider break at half song with 95% acc is my best guess.
I believe any questions on pp will be cleared further when the wiki is updated, until then we can just speculate(?
Merged topic in case there is any confusion