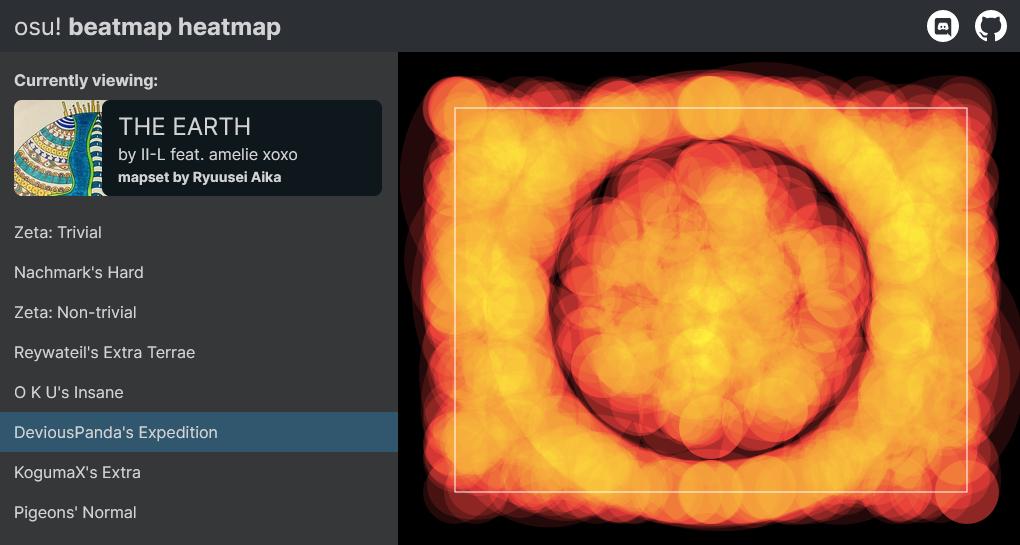
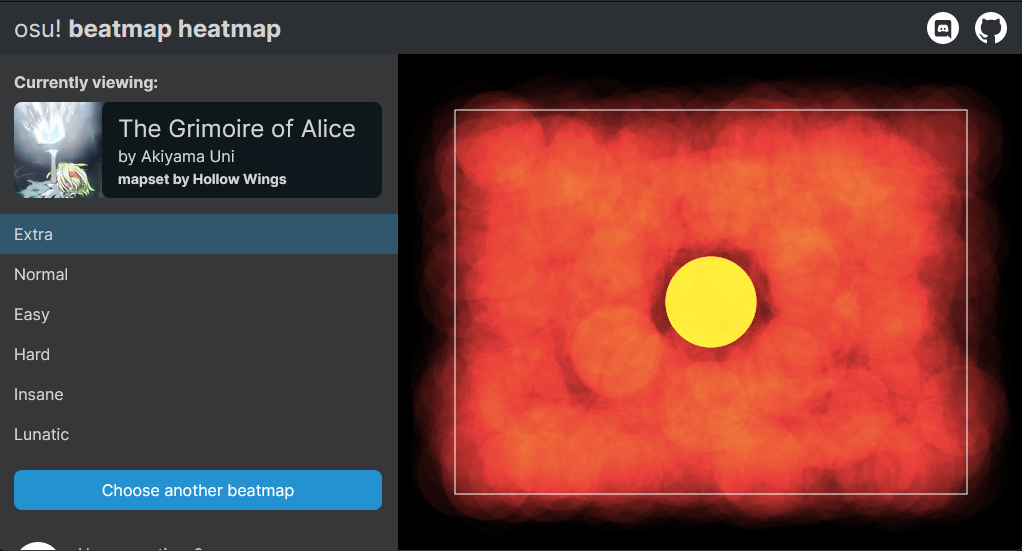
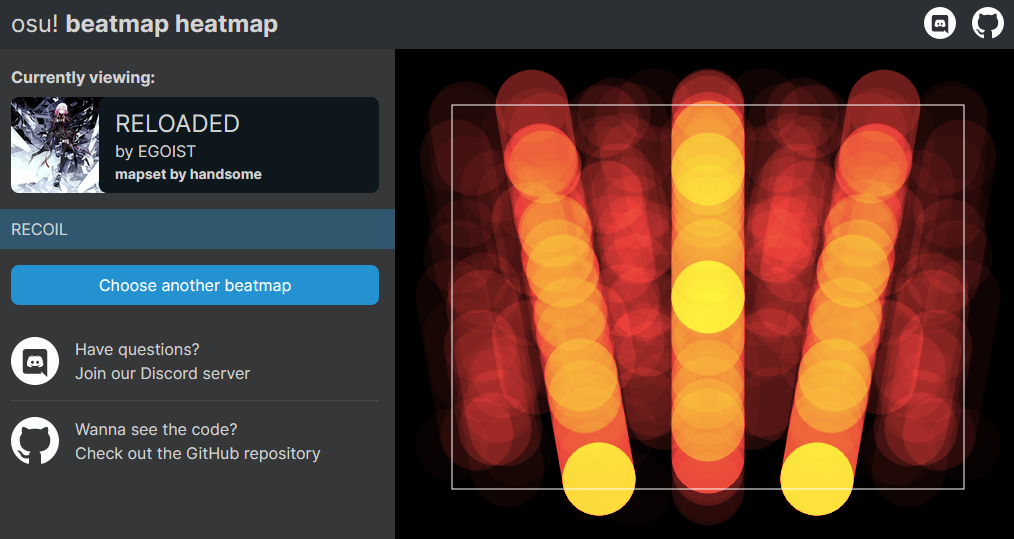
I created a website where you can take an osu! standard beatmap and generate the heatmap from the object placement. Lighter spots have more objects and darker spots have less. It's pretty simple, but really cool to see.
For most maps it's just a blob, but for some carefully designed maps with a playfield gimmick it can reveal some really cool patterns you might not have seen otherwise. I have highlighted some of the maps as examples on the website.
It may also be useful for aspiring mappers to see the playfield usage, making sure it's consistent through the whole map, effectively using the whole play area.
See the website here: https://osu-heatmap.ekga.me/
Check out the source code here: https://github.com/ekgame/osu-heatmap
If you know any more maps that look cool as a heatmap, I encourage you to post them in this thread, I might add them to the website.
Some example heatmaps:

 MUST CLICK CIRCLES