Instead of just showing the minus to positive average hit error, what about showing the hit error histogram?
forum
Show hit error histogram in the hovering statistic
posted
Total Posts
11
Topic Starter
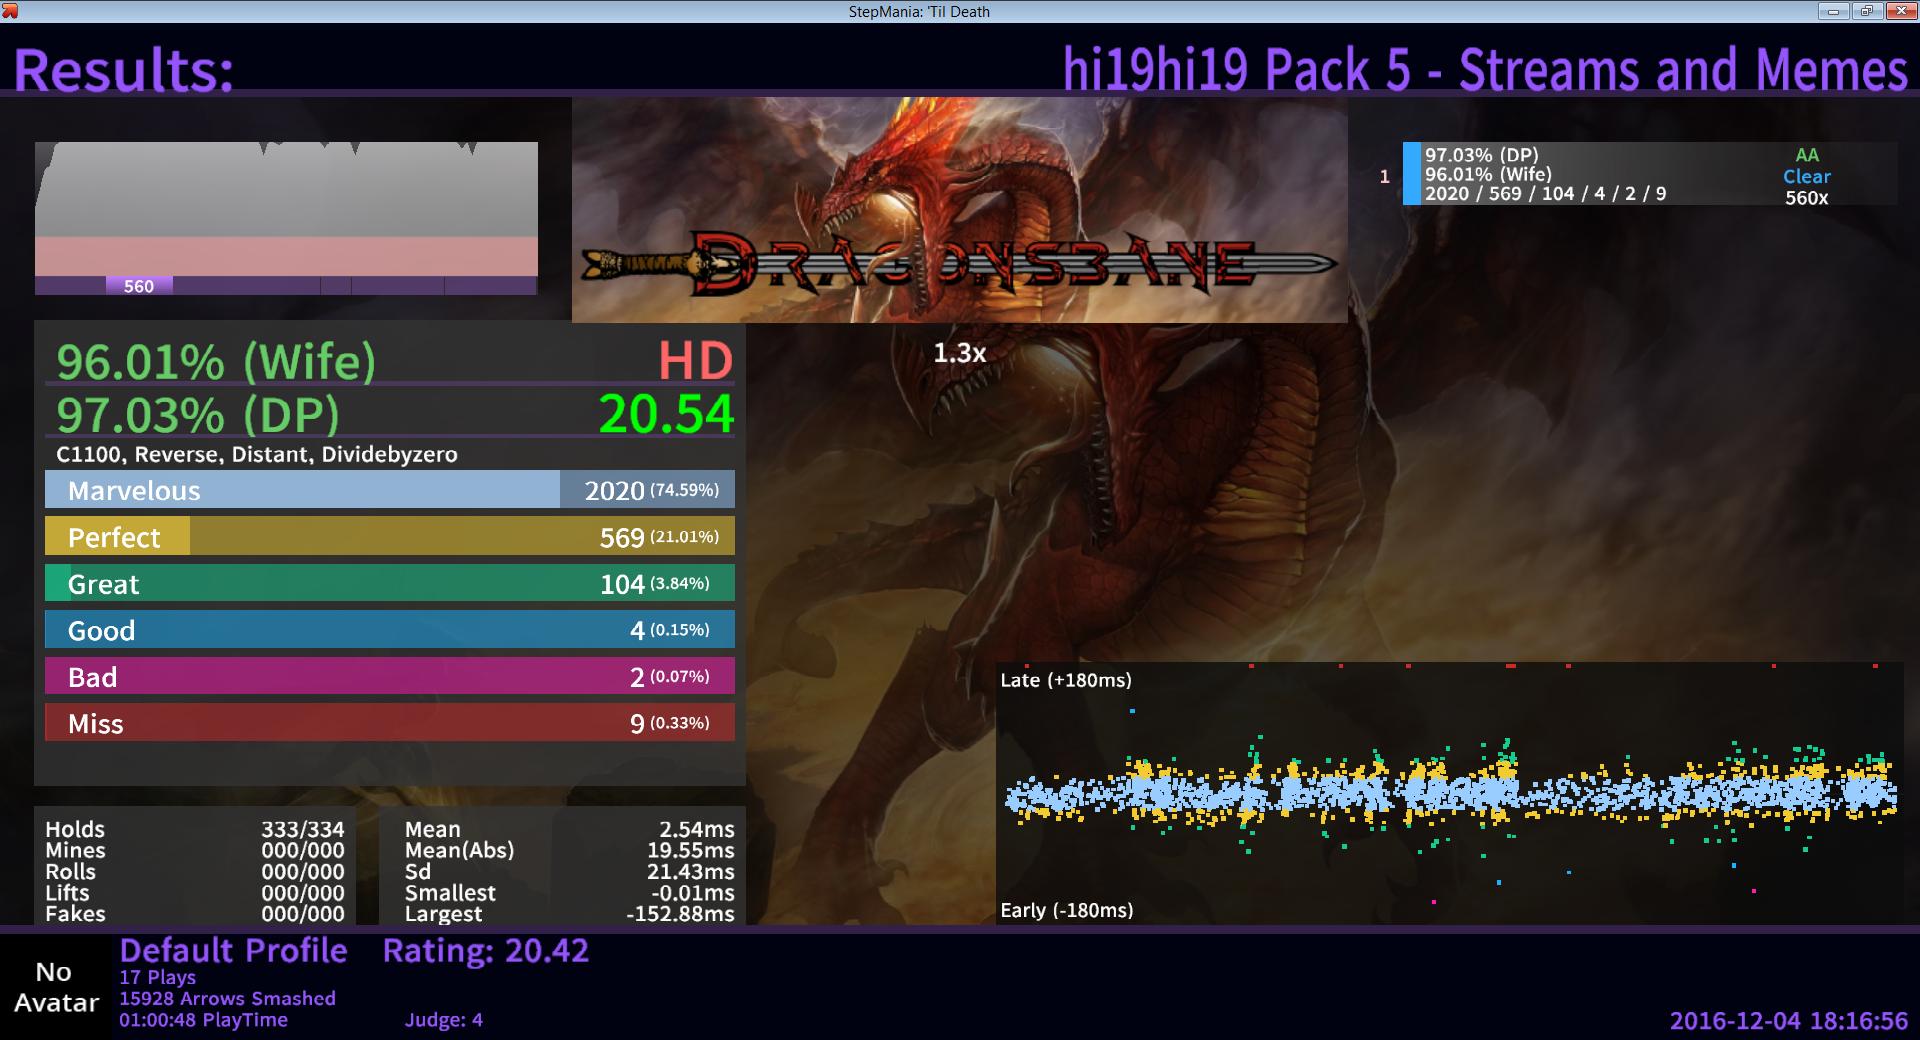
Why stop there? A histogram is not as cool as what stepmania has:

Topic Starter
abraker wrote:
Why stop there? A histogram is not as cool as what stepmania has:
A histogram would look neater though.
Topic Starter
I mean this could be implemented in map editor for better timing, but for rank score information, histogram would be sufficient enough.abraker wrote:
Why stop there? A histogram is not as cool as what stepmania has:
I have a histogram here on the right. It tells me almost nothing of value but that the replay is not a bot

Topic Starter
The original -xx ms ~ +xx ms also tells nothing, so consider removing that?abraker wrote:
I have a histogram here on the right. It tells me almost nothing of value but that the replay is not a bot
A histogram wouldn't give much more additional information, considering the table of judgment counts the result screen already gives.
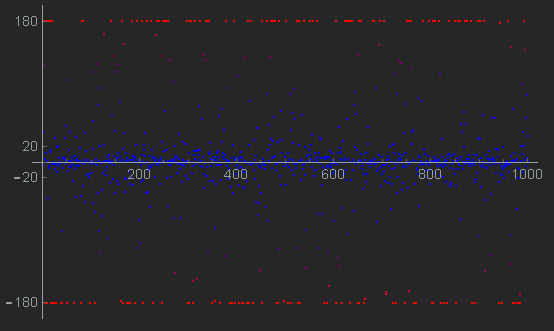
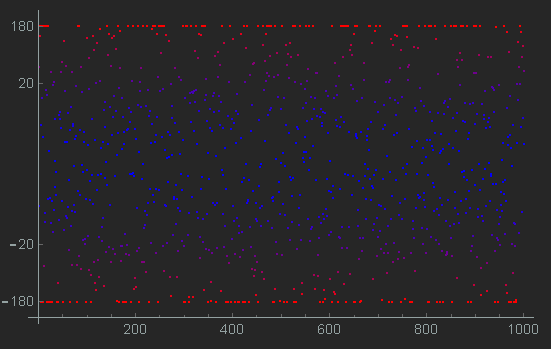
The hit error v/s time graph gives more information. But, the linear scale used makes it hard to discern errors near 0ms (too many points clustered there); what about using a scale like Ln(1+Abs(x))*(x/Abs(x))?
The hit error v/s time graph gives more information. But, the linear scale used makes it hard to discern errors near 0ms (too many points clustered there); what about using a scale like Ln(1+Abs(x))*(x/Abs(x))?
Example
Linear Scale

Ln(1+Abs(x))*(x/Abs(x)) Scale

Linear Scale
Ln(1+Abs(x))*(x/Abs(x)) Scale
Topic Starter
What counts as information though? I think histogram gives enough information about average hit error and standard deviation, and is much more compact. Here is an example http://osureplay.com/#/replay/f1536ea1f ... a00e8c5440Full Tablet wrote:
A histogram wouldn't give much more additional information, considering the table of judgment counts the result screen already gives.
The hit error v/s time graph gives more information. But, the linear scale used makes it hard to discern errors near 0ms (too many points clustered there); what about using a scale like Ln(1+Abs(x))*(x/Abs(x))?ExampleLinear Scale
Ln(1+Abs(x))*(x/Abs(x)) Scale
And as I've said, hit error v/s time graph is useful, but is a little bit too much for a score page. It is suitable for map editor to test timing.
Hit error and std dev is already displayed in results screen.chinmeitou wrote:
I think histogram gives enough information about average hit error and standard deviation, and is much more compact.
- hit error is the +/- values you see when you hover over the HP graph. Those are actually useful for determining the offset you need.
Std dev is hidden behind unstable rate and is also visible when you hover over the HP graph. At least in taiko and mania, those are useful for determining accuracy to a more precise degree than the max 100% a player can get due the discrete hit ranges
- The histogram's width can be determined using the std dev, which is a value we already get to see
The highest point of the histogram should be around the midpoint of the hit error range if it is a normal distribution, and hit error range are values we already get to see
The histogram itself will never have values more or less than the boundary at which the hit error counts as a miss. The domain for the histogram is confined within known values
The histogram will likely have a shape of a normal distribution if the play was done by a human player