Warning. There is huge amount of math. Also my English isn't good enough. Sorry about that.
I took results for top 2000 osu!players from my country (top 2000 is similar to top 50k in the world ), made spreadsheet and used some mathematical software to find hidden trends in this stats. I've found some interesting facts, this facts may be true for other countries too. It was looking something like that:
https://imgur.com/a/SGXVO
Maybe it will be interesting for someone too:
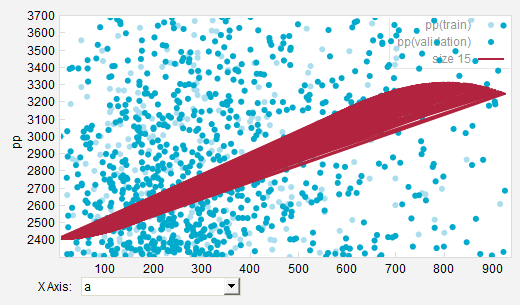
1. Advice "Play More!" is statistically confirmed! There is strong correlation 0.65 (dependence between two variables) between Play Count and total pp for players. I could say, that "Play More" is 65% what You need to get more pp. 1 or -1 is maximal correlation possible.
Other facts: average player gets about 1pp for every 8 Play Count points. There is no players in top 2000 russian players, who would get less than 1pp for every 40 Play Count points.
2. Top players have better accuracy (for account), than everage player. Average accuracy grew from 97% for 50k rank to 98.9% in the top. Also, there is group of people, who can get many pp and they have lesser than 96% accuracy. Buteven very best from them can't only very best from them can get more, than 4k pp.
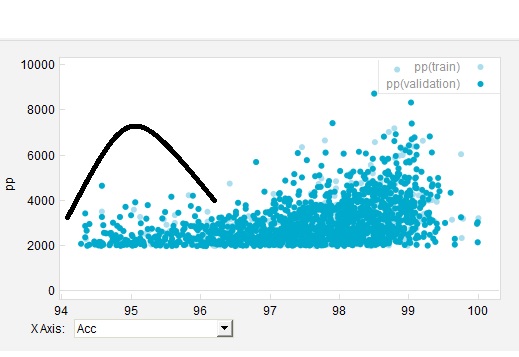
I filter suspicious results, so this must be real accounts.
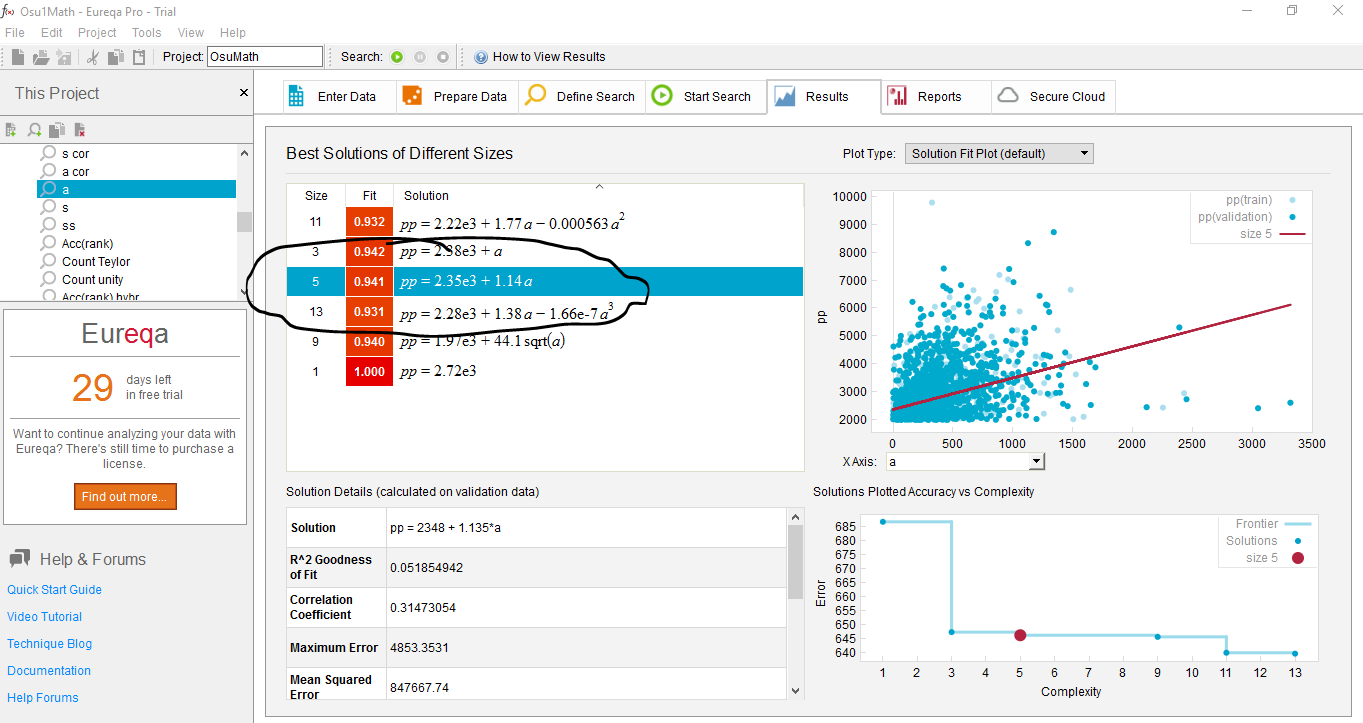
Correlation between Accuracy and pp is 0.4, so it could be good idea to improve account's accuracy up to 99%
3. It looks like, it is very important for new players to get decent level. There isn't so many people, who can get pp without at least 95-96 lvl, even if they've many Play Count points. I guess, it happens because new player need learn take big combo. When new player get big combo, he also get many level points. He can't get pp without taking combo. Correlation between pp and lvl is 0.64, just like for Play Count. Maybe trying to fc long maps is good idea for new players?
4. I've also collected some data for correlation between total pp and numbers of A, S and SS, that player can get.
for A correlation coefficient is 0.35 for S is 0.45 and for SS is 0.25
Also, people who get more than 90 SS or 800 A don't get more pp than people who get less SS or A grades.
But it is different for S. People with more S get more pp always. And also correlation is strongest for S.
Average player gets about 1.14 pp for every A (until he get 800A), 0,71pp for every S and 0,84pp for every SS (up to 90 SS)
So, it's possible to say, that, if You want get more pp, You may try improve your combo, accuracy, get some A and SS, get much more S and play more.
When I've combined all variables possible, I've got some terrifying solutions.
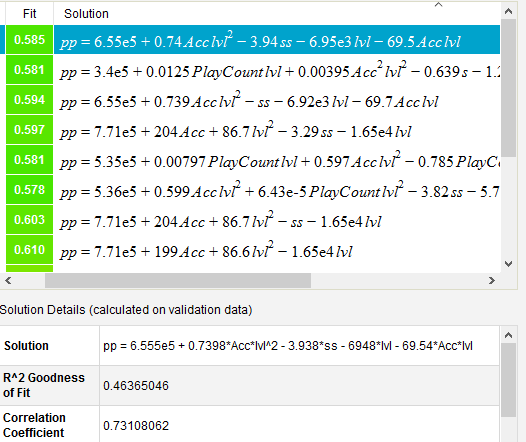
And correlation 0.73 is the best correlation, I could get.
So pp is 73% about getting A, S, SS, level, accuracy and playing more and 27% about non-related skills.
Ofc, all this is just statistics and anything can be wrong, but it's still better, than nothingness.
If You have questions, I can answer this and post more graphics, trnds and formulas. And I would be glad to hear about my numerous mistakes in English. Thanks.
tl;dr "Play more" statistically confirmed, getting ss is useless and 99/100 is perfect accuracy
I took results for top 2000 osu!players from my country (top 2000 is similar to top 50k in the world ), made spreadsheet and used some mathematical software to find hidden trends in this stats. I've found some interesting facts, this facts may be true for other countries too. It was looking something like that:
https://imgur.com/a/SGXVO
Maybe it will be interesting for someone too:
1. Advice "Play More!" is statistically confirmed! There is strong correlation 0.65 (dependence between two variables) between Play Count and total pp for players. I could say, that "Play More" is 65% what You need to get more pp. 1 or -1 is maximal correlation possible.
Other facts: average player gets about 1pp for every 8 Play Count points. There is no players in top 2000 russian players, who would get less than 1pp for every 40 Play Count points.
2. Top players have better accuracy (for account), than everage player. Average accuracy grew from 97% for 50k rank to 98.9% in the top. Also, there is group of people, who can get many pp and they have lesser than 96% accuracy. But
I filter suspicious results, so this must be real accounts.
Correlation between Accuracy and pp is 0.4, so it could be good idea to improve account's accuracy up to 99%
3. It looks like, it is very important for new players to get decent level. There isn't so many people, who can get pp without at least 95-96 lvl, even if they've many Play Count points. I guess, it happens because new player need learn take big combo. When new player get big combo, he also get many level points. He can't get pp without taking combo. Correlation between pp and lvl is 0.64, just like for Play Count. Maybe trying to fc long maps is good idea for new players?
4. I've also collected some data for correlation between total pp and numbers of A, S and SS, that player can get.
for A correlation coefficient is 0.35 for S is 0.45 and for SS is 0.25
Also, people who get more than 90 SS or 800 A don't get more pp than people who get less SS or A grades.
But it is different for S. People with more S get more pp always. And also correlation is strongest for S.
Average player gets about 1.14 pp for every A (until he get 800A), 0,71pp for every S and 0,84pp for every SS (up to 90 SS)
So, it's possible to say, that, if You want get more pp, You may try improve your combo, accuracy, get some A and SS, get much more S and play more.
When I've combined all variables possible, I've got some terrifying solutions.
And correlation 0.73 is the best correlation, I could get.
So pp is 73% about getting A, S, SS, level, accuracy and playing more and 27% about non-related skills.
Ofc, all this is just statistics and anything can be wrong, but it's still better, than nothingness.
If You have questions, I can answer this and post more graphics, trnds and formulas. And I would be glad to hear about my numerous mistakes in English. Thanks.
tl;dr "Play more" statistically confirmed, getting ss is useless and 99/100 is perfect accuracy