stats lul
balance both
balance both
Farming boosts you short-term, that's obvious. The question is if it hurts you long-term or not. We can check that by looking at players that are already playing a long time (higher ranked players, generally)Rayne wrote:
You can't generalize stuff like that.
Obviously people who retry a lot on pp maps are going to "improve" (their pp) a lot faster than people who almost never do so and F2 all the time.
gladlyPawnables wrote:
Good god the detail is strong with this one.
Make a tl;dr pls.
ManuelOsuPlayer wrote:
Hitcount dosn't mean nothing.
Player who plays longer maps have more hitcount. And that dosn't mean they retry less.
In my personal case i can't retry without getting worst.
how do I get better?pandaBee wrote:
You do realize that the people we give the "never retry" advice are a different subset of players than the top 10k? Do you really think the top 10k come to G&R for advice? More like 100k and up.
There's certainly a lot going on with the data, which is also why we have such a low correlation, but most things shouldn't mess with the trend line itself. For example.. there is no reason to believe that non-meta players, inactive players and so on have a higher or lower hit per play ratio, so these types would probably be distributed evenly over the x-axis and therefore cancel out. Rhey're going to be the same as the outliers that I removed in the "Filtered"-chart. They don't actually have an impact on the result. As I said, if the inaccuracies don't distort the trendline down or up in a systematic manner, there's no reason to be concerned about them.N0thingSpecial wrote:
Your data still have too much other variables affecting it like inactive players, non meta players, just the fact that no one’s improvement graph has a linear progression shows that your data could vary based on when you collected the data.
We're looking at quite a good range for "hits per play", from ~150 to ~300. I doubt that they're just all the same. People who retry less are going to sit closer to 300, people who retry more are going to sit closer to 150. Occasionally you'll get the guy who plays a lot of marathons but apart from that actually retries quite a lot and then still ends up with a higher number. But again, the correlation should still be there.N0thingSpecial wrote:
What if there’s so little people who actually retry less, that you’re just plotting graph of people who retry just as much as each other?
sure, why not? "Play more" works for new players just like it works for pro players. Rohulk is preaching "never retry" to everyone indiscriminately, and religiously follows his own advice. "Challenge yourself and push your limits" has always been a cornerstone of improvement no matter where you go or what you do, it doesn't just apply to osu. Do you see any good reason why extrapolating the results wouldn't work?pandaBee wrote:
Using data from the elite playerbase to make conjectures about the bottom of the barrel dregs of circle clicking society? Peppy pls.
There are plenty. A few off the top of my head:Railey2 wrote:
sure, why not? "Play more" works for new players just like it works for pro players. Rohulk is preaching "never retry" to everyone indiscriminately, and religiously follows his own advice. "Challenge yourself and push your limits" has always been a cornerstone of improvement no matter where you go or what you do, it doesn't just apply to osu. Do you see any good reason why extrapolating the results wouldn't work?
Wow what a shameless plug :^)Endaris wrote:
Of course I support the idea of retrying.
That is why it is part of the core of my gameplay guide which you can check out here.
And always remember: Retry smart, play hard!
Full Tablet wrote:
With a linear fit with r = -0.116515. This shows there is a very slight negative linear correlation between the average length of each play of the player, and the efficiency the player obtains pp.
Almost wrote:
Full Tablet wrote:
With a linear fit with r = -0.116515. This shows there is a very slight negative linear correlation between the average length of each play of the player, and the efficiency the player obtains pp.
No offence but you must be crazy to call that a correlation.
Full Tablet wrote:
Almost wrote:
Full Tablet wrote:
With a linear fit with r = -0.116515. This shows there is a very slight negative linear correlation between the average length of each play of the player, and the efficiency the player obtains pp.
No offence but you must be crazy to call that a correlation.
Considering the large sample size (n=10000) and r = -0.116515, then the variables are significantly correlated (i.e. the null hypothesis of the variables having no correlation whatsoever is rejected) at a significance level of 1%.
Example of variables not significantly correlated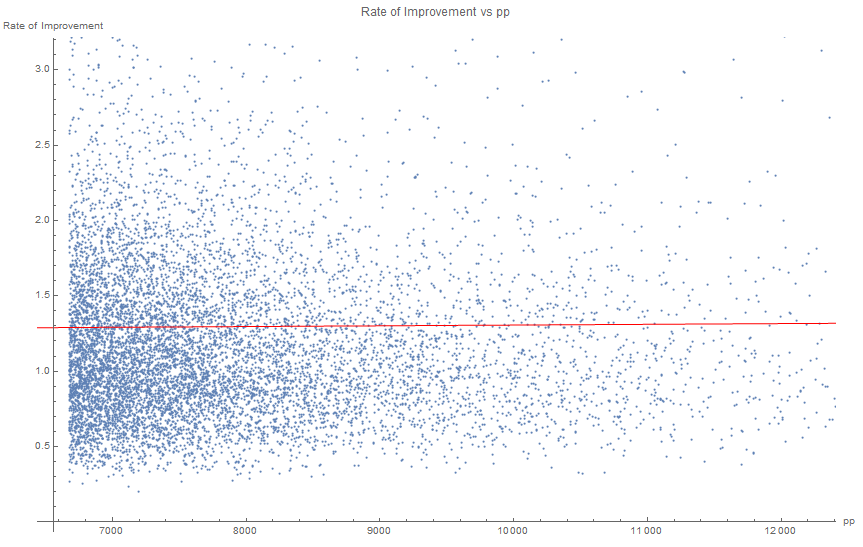
With r=0.0054, which is not a significant correlation (which is not surprising, since the "rate of improvement" was defined in a way that makes it uncorrelated with pp)
Almost wrote:
The correlation is so poor that if you picked a random player with a certain average play length, you would literally have no idea what their rate of improvement would be because there's so much noise in the data. It really doesn't matter how much data you have, this data doesn't show anything meaningful.
Full Tablet wrote:
Almost wrote:
The correlation is so poor that if you picked a random player with a certain average play length, you would literally have no idea what their rate of improvement would be because there's so much noise in the data. It really doesn't matter how much data you have, this data doesn't show anything meaningful.
https://en.wikipedia.org/wiki/Law_of_large_numbers
https://en.wikipedia.org/wiki/Insensitivity_to_sample_size
https://en.wikipedia.org/wiki/Correlation_does_not_imply_causation
Given the data, we can conclude with confidence that there is indeed a negative correlation between the variables in the population (high-ranked osu! players), and that the correlation between them is not coincidental, even though, as you said, for each specific player we can't predict accurately their improvement rate given the average length of their plays.
Now, for concluding there is a causation (having low average play length increases the efficiency of obtaining pp), there are still other things to consider and to prove:
- Prove That the relationship can not be explained by a third factor, that both decreases the average play length, and increases the improvement rate (or vice-versa).
- Prove that being efficient at obtaining pp doesn't somehow decrease the average play length. (This proof is sufficient, but not necessary, since there is also the possibility of bidirectional causation).
- In the case of generalizing to a bigger population (for example, all osu! players, instead of just high-ranked osu! players), one would need to prove there isn't something inherently different between the two groups (high-ranked and lower-ranked) that affects the correlation or causation. For this, it would be useful to repeat the analysis but with a random sample of all players instead of only taking the top 10k.
- In the case of trying to prove that retrying mid-play is beneficial for obtaining pp, one would need to account for differences between lengths in different maps played by different players. As far as we know, it is also possible that players that play longer maps tend to get pp less efficiently, regardless if they retry or not.
Almost wrote:
Just to state it out here, I have not accused you of implying causation. I am simply pointing out that there really is no correlation here at all. To put it simply, you are extrapolating noise! You can't just look at the r number and then say there is or is not correlation. If you eyeball the data, it's plainly obvious that there's no correlation. The fact you need a computer to draw out a line for you is evidence of this.
Full Tablet wrote:
If the data were totally uncorrelated, then the probability of obtaining a value of r=-0.116515 or less, with a sample size of n=10000, would be very low (less than 0.001%). The null hypothesis of there being no correlation in the population is rejected. This doesn't mean that the correlation is strong (in fact, it is very weak), it just means that the correlation exists.
You are probably thinking about the possibility of there being measurement errors in the variables by noise. If the measurement noise in the samples is big enough and correlated, this can lead to finding spurious correlations that do not represent the true trends in the population.
Possible sources of measurement errors in the data are:
- Cheaters, who aren't representative of the population we are interested in. Cheating leads to a fake higher improvement rate over not cheating, but it is reasonable to assume that it also leads to a higher average play length (due to not needing to retry beatmaps to get good scores). Thus, cheaters actually make the apparent negative correlation weaker than the real correlation.
- People who selectively only submit plays that give them pp, giving them a fake low hitcount and playcount value, and thus a fake high improvement rate. Similar to the previous case, this also leads to higher average play length due to retries not being counted in the data.
- People who play offline, or play unranked beatmaps. Similar to the previous case, this behavior also gives a fake high improvement rate (but not as much as the previous case), but there shouldn't be a correlation with average play length (or, maybe, there is a positive correlation, since playing unranked/offline might be correlated with not caring about obtaining pp, and that attitude is in turn correlated with retrying less or playing longer maps).
- People who multi-account, or that have had scores deleted. This leads to a higher measured improvement rate, but shouldn't affect the average play length.
- Plays that have been randomly lost due to connection problems. This causes uncorrelated and random noise in the measurements.
- Other sources of noise I haven't thought of.
Considering the sources of noise I mentioned, it is actually reasonable to assume that the real correlation is stronger than the measured correlation, unless I am missing some important source of measurement errors, or I am assuming wrong about the correlations in the sources of noise.
Antiforte wrote:
I think we can all agree that there is no conclusion about skill to draw from pp, a flawed and constantly exploited skill metric (if it even counts as one).
Almost wrote:
The probability of such a correlation occurring is completely irrelevant. You could get 2 random data sets that happen to spuriously correlate and find they have a 0.001% of not being correlated statistically. Therefore, moot point.
I also find engaging in hypothesizing what the 'true' correlation to be rather pointless as it's realistically impossible to gain this data. Yes, you could potentially find a real negative correlation but at the same time, you could find the opposite to be true. This analysis provides really nothing meaningful and nobody should really be wasting their time thinking too much about it.
Full Tablet wrote:
https://en.wikipedia.org/wiki/Statistical_significance
https://en.wikipedia.org/wiki/Effect_size
https://en.wikipedia.org/wiki/Misuse_of_p-values
If you measure in a sample that there is a negative correlation, and the probability of not measuring that there is a negative correlation in case there is no negative correlation is 99.999%, the most reasonable conclusion is that there is indeed a negative correlation. If you only accepted empirical conclusions that have 100% certainty, you wouldn't be able to conclude anything, you wouldn't even conclude that gravity exists or that the Sun shines.
You are confusing statistical significance with effect size or magnitude of the effect. An example of high statistical significance with low effect size: a statistical study finds, with high confidence, that, obese people, eating a certain plant at least weekly, lose 0.1±2.0 more kilograms of weight each month (compared to not eating the plant at least weekly).
While the results might appear to be worthless (after all, the average effect is so small, and the variance of the outcome is so high, it is not worth it to influence the variable hoping to change the outcome), it does tell us some important things.
First of all, it tells us that it is not reasonable to expect the opposite effect of what was seen (that increasing the average play length increases the efficiency of getting pp). Also, the low value of of r tells us that, while in average we should expect a negative effect in pp farming efficiency when increasing the average play length, we can't predict the precise outcome with confidence.
Almost wrote:
If anything, you're the one confusing the value of the p value. Firstly, you can use a simple p value correlation calculator (like this one) and find that you only really need the r value as well as the number of samples to calculate the p value. Therefore, what dictates the p value is simply the number of samples; with a r score further away from 0 requiring a higher number of samples to give a lower p value.
Again, you cannot simply just look at the numbers only as the numbers only tell you half the story. If you were to just look at the numbers alone, it's evident that a correlation exists. However, intuitively looking at the data itself, it is clearly evident that a real correlation does not exist for practical purposes.
Also, any conclusions you might draw from this data will be seriously flawed due to all the possible sources of measurement errors in the data that you mentioned earlier. This means that drawing any conclusions at all is quite dangerous.
Full Tablet wrote:
A r score further away from 0 requires a lower amount of samples to obtain a certain p value, not a higher amount of samples.
Full Tablet wrote:
Looking at the scatter plot is more useful when the sample is smaller. Intuition generally fails when the amount of data is more than what one can visually process. In particular, by looking at the graph, we can correctly infer that the correlation is not high, but that doesn't imply that the conclusions you draw from the data aren't relevant. The correlation is not to be ignored if the underlying implications of such a weak correlation make sense to be reported to a research community. Any r > 0.1 on a large data set is always something to look into.
https://en.wikipedia.org/wiki/Correction_for_attenuation
As I said earlier, if we consider the sources of the error, it is actually more likely that the real correlation is higher than what was found in the analysis, than the other way around. It takes particular kinds of measurement errors to cause spurious correlations.
Almost wrote:
Compare the plot you provided with these 3 plots.
Visually you can see it's more similar to the 3rd no correlation plot than to either of the positive or negative correlation plots.
Almost wrote:
Again, just because you can mathematically calculate an r value greater than or less than 0.1 with a significant p value doesn't mean it's 'real' correlation at all. Again, the p value is predicated more on the sample size than anything else so as long as you have enough samples you can get a significant p value no matter how erroneous everything else is. Anyway, a correlation of -0.11 is already a super weak correlation and paired up with the fact that the data has an enormous amount of variance as well as the poor quality of data allows us to conclude that nothing of meaning can really be drawn from this analysis.
Almost wrote:
Now to explain what we see further, you can see that the vast bulk of the play lengths of the players in the data set tend to be around the 150-250 range with far fewer players on the higher end compared to the lower end of the range. Also, the rate of improvement is also more clumped towards the lower end of the range (around 0.5-1.5) no matter what average play length you pick. [...] You can't really extrapolate that this correlation would hold if you were to have more players in the data set on the higher end of the average play length range as the variance is so huge on all ends of the spectrum which would likely end up just leading to a no correlation result.
Almost wrote:
The line of best fit in the plot you gave would clearly skew more towards the negative side of things due to the higher representation of the variance in the lower average play length side of the plot.
Full Tablet wrote:
If there is no correlation, it is almost impossible to obtain a value of r<=-0.11 with a large sample. When there is no correlation, as you increase the sample size, |r| tends to approach 0, so it is not true that as you increase the sample size you are more likely to find a statistically significant correlations when there are actually none.
Full Tablet wrote:
Yes, due to not having much data outside the 100-250 play-length, we can't infer much about the effect of play length on improvement rate outside that play-length range (but still, we do have information about the effect inside the range).
Full Tablet wrote:
If we sampled again with more data outside that range, and found that the correlation is weaker across all the range, then we would need to check for non-linear relationships between the variables. For example, it is possible that there is a bitter spot in play-length (for small play-lengths, increases of play-length tends to decrease improvement rate, and for big play-lengths, increases of play-length tends to increase improvement rate).
Full Tablet wrote:
I am not sure I understand what you are trying to say here.